Português do Brasil
 Español
 Português
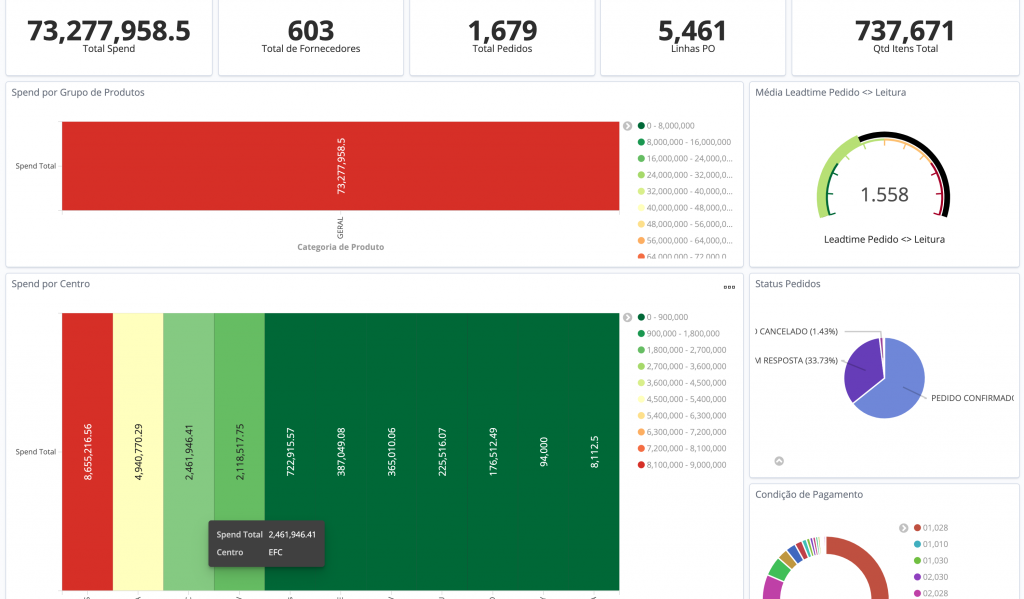
ME Boost is Mercado Eletrônico’s tool focused on the smart and strategic control of the procurement area within organizations. The solution adds Business Intelligence (BI) technology to B2B purchases and has been designed to make procurement management easier, and help businesses to control their processes.
Several improvements have been added to this functionality over the last months and, in this post, you can check some of them.
Are you ready? So keep on reading!
How does ME Boost work?
The tool has a scalable search engine and stores huge information volumes; it interprets also all content in charts, adapted to the needs of each user, with the possibility of creating filters for detailed analysis.
It’s also offered in the SaaS (Software as a Service) model, and is integral part of all modules of Mercado Eletrônico’s offer. All data can be accessed through the web, and it can be also programmed to identify data patterns and show different views, to enable possible action plans to the manager.
ME Boost: Dashboards for data tracking
To make the tool even more robust and complete, Mercado Eletrônico’s team has been working constantly to improve it.
The platform allows filtering data by period to make reference easier – which by consequence facilitates also any audit of the area, whenever required.
ME Boost offers four dashboard types that are fully customizable, to allow carrying out the procurement area’s strategic analysis.
See each one of them below:
Transactional dashboard
On this screen, the manager will have access to data related to all transactions done by the company, offering data such as “Order Quantity x Branch”, “Request Status per Item”, “Financial Volume x Branch” and “Order Volume per Buyer”, for instance.
Negotiation dashboard
In this dashboard, the manager will be able to check performance of the procurement area with regard to any negotiation. Charts of Average Saving per Supplier, Saving by Average Price, Saving achieved in the last transaction with a given supplier, Saving achieved per buyer, and Saving according to product family are provided, among others.
In other words, the area’s performance can be analyzed during the negotiation process, to think about alternatives and solutions, if necessary.
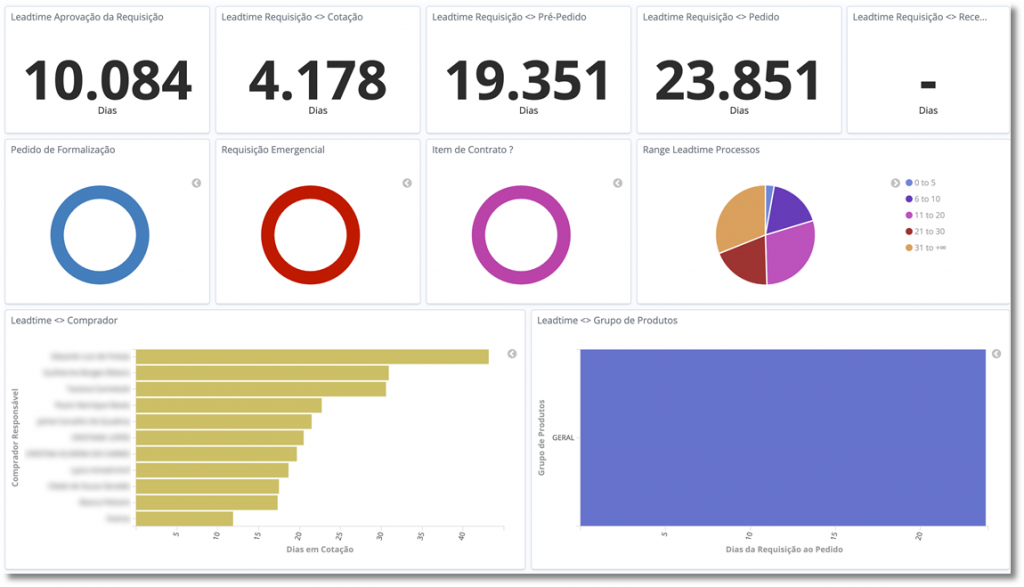
Lead time dashboard
On this screen, data are displayed on the time of each process in the procurement area. The manager can check the average approval lead time per request, the average lead time per quotation, the time taken for a request to become a pre-order, the average time taken for a request to become an order, which buyer has the longest process, and other strategic information for the business.
Order dashboard – Spend analysis
This dashboard provides general information about spending in the procurement area. The overall spent amount can be checked, along with all suppliers used so far or by period, the total of orders, the total line/item count purchased, spend per item category, the average time each supplier takes to read/answer a request, spend per branch, etc.
If your company requires more control and decision-making power, click here and ask for more information about Mercado Eletrônico’s ‘ME Boost’ solution.
And subscribe to our newsletter, to stay updated on everything that happens in the B2B market.
See you next time!