Português do Brasil
 Español
 Português
The procurement area is no longer just a purchase department for a very long time now. Nowadays, that area is recognized as a vital one for any business to take off. And despite the complexity of the B2B procurement cycle, technology has been changing and shaping its processes, from request to payment, thus facilitating the journey of procurement teams.
One of the activities that requires very much attention from buyers is the evaluation of proposals received from suppliers. After all, $1 saved in purchases means $1 in profit for the company. Despite this fact, the choice for the best cost effectiveness goes well beyond price – and several factors must be considered when making a decision.
Therefore, with the mission of helping buyers, Mercado Eletrônico’s Product team developed the comparative map.
Keep on reading!
Mercado Eletrônico’s comparative map
The Comparative Map is a feature of Mercado Eletrônico’s e-Procurement solution, which makes more intelligent the process of analyzing and comparing quotations sent by suppliers.
On a single screen, the map matches all data extracted from proposals automatically. You can then compare all those data, such as price, freight and delivery, and also pinpoint the best proposal and calculate savings. Additionally, you can use dynamic filters to make more advanced and specific comparisons, and then make quick and assertive decisions.
See below the key benefits of this feature:
Visibility and speed
To compare proposals, professionals usually rely on Excel spreadsheets, wasting a lot of time with this manual process.
The comparative map feature allows you to view, side by side, the important data of all proposals submitted by different suppliers, on a single screen.
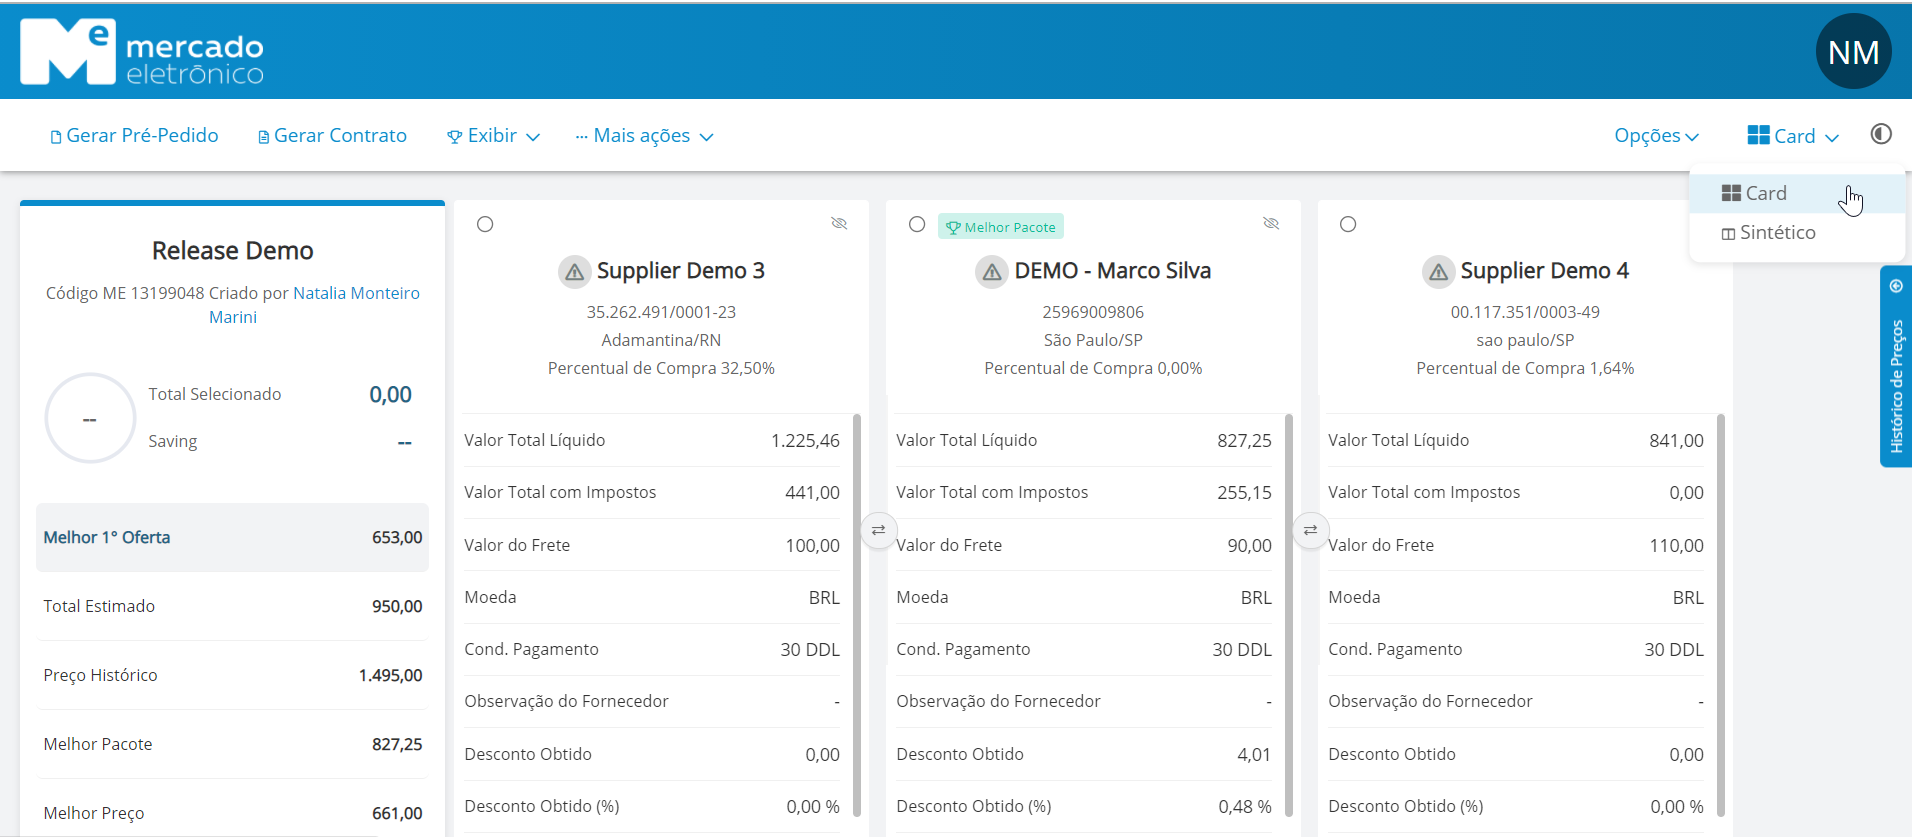
The card mode provides an analytical view of all items.
Customization
The comparative map is customizable for users. The buyer can view or hide quotations, choose the order of the answers, and use filters in the comparison fields, among other applications, to make the analysis and choice of the best quotation easier.
In addition, the interface has two viewing modes – card and synthetic – and also the night mode, for those who prefer to work at night.
Consolidation of values
Here the buyer can access the consolidated quotation data. In other words, he/she can view several data, such as “best 1st offer”, “estimated total”, “historical price of each item’s last order”, “best package” and “best price”.
All such data are generated automatically, and the buyer can select the desired option to view each quotation, according to the chosen criteria.
Savings calculation
The comparative map calculates the savings automatically. Just select one or more items from the quotation, and click on the summary of the desired data for your calculation: “best 1st offer”, “estimated total”, “historical price”, “best package” or “best price”.
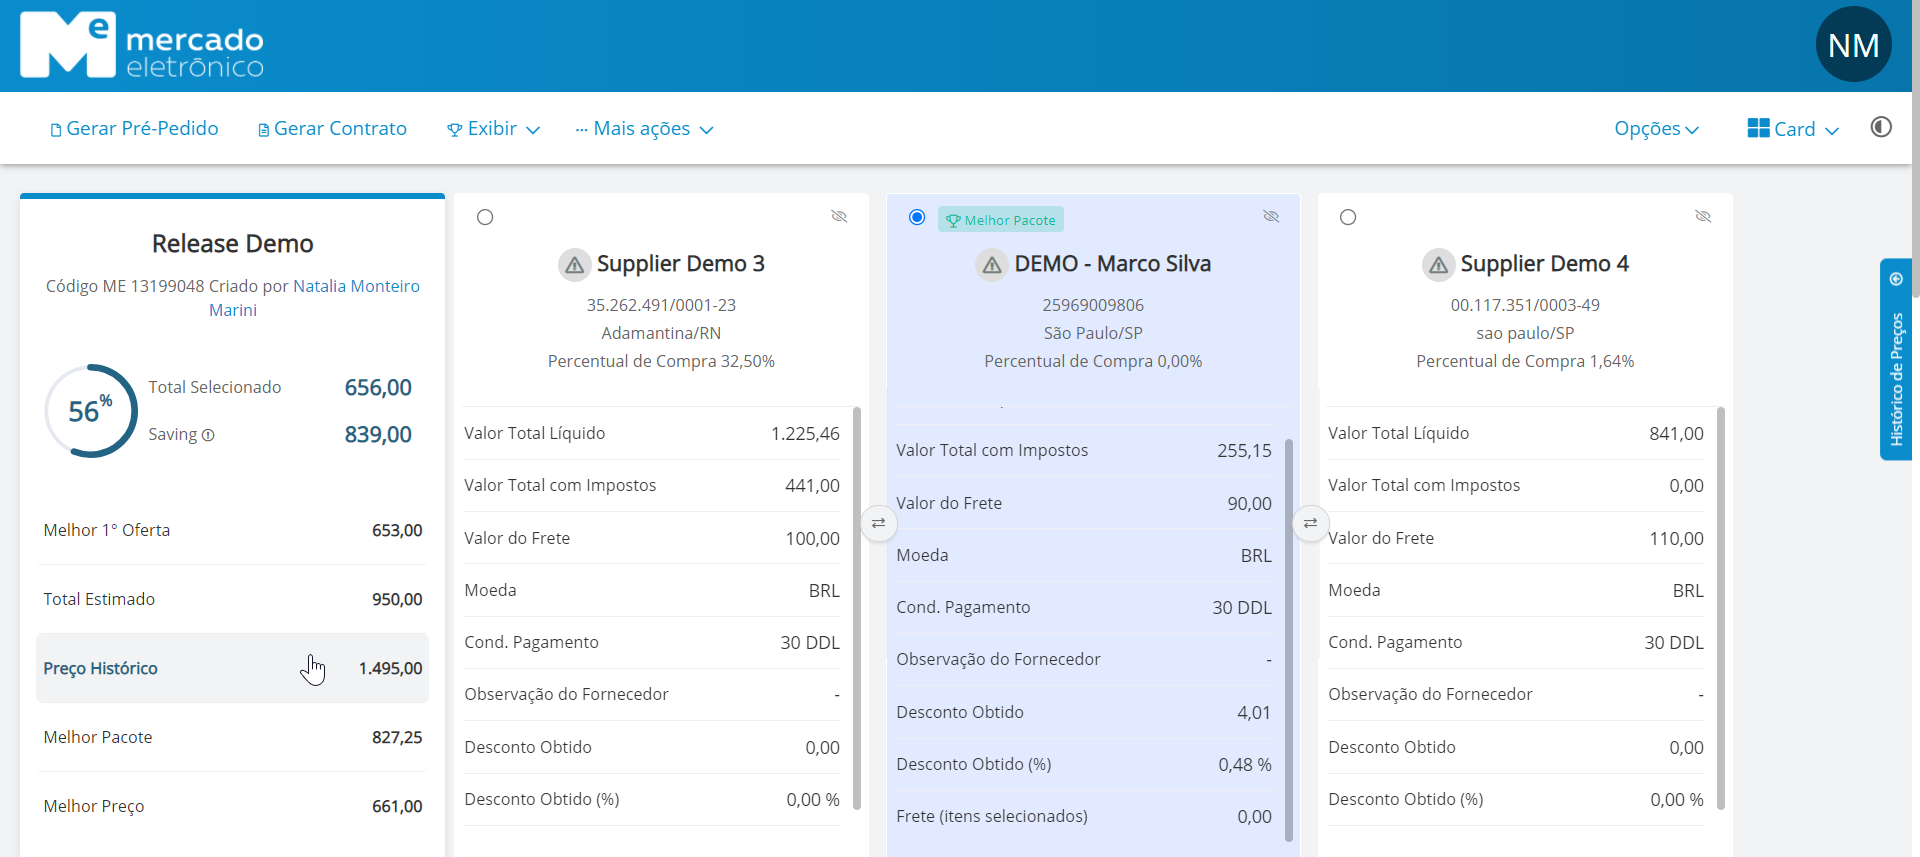
The “price history” option was selected in this example.
The above image shows the key benefits of our comparative map – which, besides streamlining the supplier selection process, provides insights to your business, such as the automated calculation of savings.
Request a free demo of our e-Procurement solution and discover this feature.
Access this link and talk to one of our experts.
See you next time!